
The "Unspecified error"/"Unexpected error" messages in Visual Studio .NET
If you worked with source control integration in VisualStudio .NET 2002 or VisualStudio .NET 2003, you might have seen at some point an "Unspecified error" or "Catastrophic failure" message like the ones below:
Visual Studio .NET 2005 displays similar "Unexpected error" messages, a bit more user-friendly and containing more debugging information:
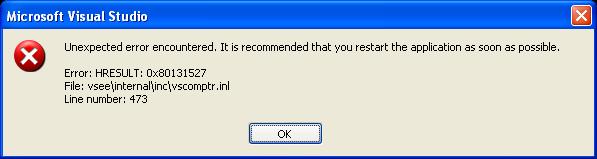
When the source control integration package encounters an unexpected situation with which it cannot cope, it throws a _com_error exception. The exception is later caught by Visual Studio shell and an error message is displayed to the user.
If you see one of these messages, it can mean one of these things:
- you have found a bug in VisualStudio
- your machine has some configuration issues (either with Visual Studio or with your source control provider, etc)
- one of the solution or project files has some corruption
So, what can you do if you've seen one of these "Unspecified error" messages"?
If you've seen the message in VisualStudio 2005 you can start by searching your preferred search engine (search.msn.com, google.com, etc), with the exact debugging information displayed by the message (HRESULT number, file name, line number). Other people may have hit the same issue before you, and they may have already identified the cause and possibly may have a solution or workaround.
You can also ask directly the source control integration team at Microsoft by e-mailing ssnetint email alias, or even better, by opening a product bug.
You can do that by going to Visual Studio Product Feedback page and follow the Report_a_bug link. When choosing to send a report to Microsoft, please attach as much information as possible, that could help developers reproduce the problem:
- attach a MINIDUMP from the moment the error was generated (not when the message is displayed!); see below how to create the minidump file.
- describe exactly what were you doing when you got the Unspecified/Unexpected error message
- if possible, attach a copy of the project or solution that caused the problem; if this is not possible, describe the structure of the solution on your local hard disk and in the source control database (project types, their disk locations, if there are files shared between projects, source control bindings of projects, etc)
How to save a minidump when the unspecified error exception is thrown
Note: If you are using VS2005 and not able to find the exact menu commands I describe below, you are probably running VS using a VB or Web profile. You should use Tools/Import And Export Settings menu command to Reset All Settings to General Development Settings or to Visual C++ Development Settings and save a backup of current settings so you can restore later your config.
How to save a minidump when Visual Studio crashes during a source control operation
Although VS may crash during a source control operation, it is not always the source control integration package's fault. It may be the source control provider actually crashing, or it may be the project's code causing the access violation (e.g. when files gets reloaded in the IDE after the source control operation completed). To establish the culprit, please send Microsoft the minidump at the time the crash happened.
You can get the minidump following the steps above (for the Unspecified error), with a small difference: in steps 8 and 9, instead of trapping _com_errors, set the Visual Studio debugger to break on "Access Violations" (c0000005) and "Stack Overflows" (c00000fd) exception types, under "Win32 Exceptions" nodes (these are most common type of crashes).
(Back to SourceSafe and source control integration page)